
This is part two of a blog series where we answer all of your probing questions… about flow measurement probes! Today’s blog features our most accurate probe for gas flow measurement – the 3D probe.
3D probes are available in two geometries: prism or spherical. As their name suggests, their purpose is to characterize gas flows in three dimensions, measuring the x, y, and z components of the flow velocity.

How does a 3D probe work?
Regardless of their shape (spherical or prism) all 3D probes have five pressure holes in the probe head. Through both proper alignment and careful calibration techniques, all five pressure orifices enable the technician to determine the x, y, and z velocities along with the overall velocity and flow rate. Unlike an S-type pitot probe with only two orifices, a 3D probe can detect more information about the flow stream, such as the pitch and yaw angle of the flow.

Similar to other pressure probes, 3D probes work by applying Bernoulli’s principle, which establishes the relationship between differential pressure and flow velocity. In the case of a 5-hole probe, the probe head is first aligned with the flow such that the pressure is equal between the P2 and P3 orifices. This alignment is called the null position. Once the probe is in the null position, the following application of Bernoulli’s equation is used to calculate the axial velocity at the point of measurement, using the differential pressure between orifices P1 and P2, or Δp12, which is calibrated to represent the dynamic pressure of the gas stream.

The velocity equation also depends on both the yaw angle (θnull), determined by the null position and the pitch angle (α). The factor F2 is gathered in the probe calibration process along with the relationship between the pitch angle (α) and the P4 and P5 pressure difference, Δp45, sometimes referred to as the pitch pressure. The density (ρ) must be calculated from the fluid temperature.

Pitch (α)and yaw (θ) angle for a 3D probe setup
To calculate the overall volumetric flow rate, the probe must sample at multiple points across a duct or stack. The combined average axial velocity from the traverse points, along with the fluid density, will determine the volumetric flow.
What is the measurement range?
ASE’s 3D-probes can be calibrated over a measurement range of 20 ft/s – 250 ft/s (6 m/s – 76 m/s) and are rated up to temperatures of 800°F (425°C).
What advantages and disadvantages should I consider before selecting a 3D probe?
A 3D probe is a highly accurate probe that can be used in many kinds of flow conditions. Unlike the S-type probe, it is quite accurate even in non-axial flow. That means the probe can even be used in ports that are close to flow disruptions such as a bend in a duct. The widely-used S-probe can only determine velocity in the axial direction. The plot below shows that the S-probe will have significant error as the flow yaw and pitch angle get further from zero. This also means that the S-probe is much more sensitive to misalignment.

S-probe error in a wind tunnel at various yaw and pitch angles
These data represent wind tunnel measurements using an S-probe positioned at various yaw and pitch angles. The horizontal axis represents the yaw angle of the probe in the wind tunnel and the marking color represents the pitch angle. The vertical axis represents the percent error in the resulting S-probe measurement. These results show that significant errors can occur when flow is non-normal. Conversely, 3D Probes can achieve much higher accuracy, since they are able to account for yaw and pitch flow angularity.
Throughout a 3D probe test, the pressures at the five orifices are monitored via three separate differential pressure measurements (P1-P2, P2-P3 and P4-P5). This is in contrast to an S-probe, where only a single differential pressure is required (P1-P2). In addition, the static pressure and temperature are monitored throughout the testing for 3D and S-probes, alike. Monitoring the differential pressures manually is possible but time-consuming, which is why we recommend pairing a 3D probe with one of our data acquisition systems for user-friendly testing in a fraction of the time. Our systems are designed specifically for 3D probe testing, with automated recording of null angle, pressures, and temperature for each traverse point. The probe-specific calibration settings enable velocity and flow rate to be calculated and reported in real time, right at the stack.
Spherical and prism-style 3D probe heads will perform similarly, but there are some distinct advantages of each style. Due to its geometric symmetry, the spherical head tends to have very good calibration repeatability across a range of velocities. This means that a single calibration curve can be used to achieve accurate results across a range of operating conditions. In contrast, the prism probe tends to exhibit Reynolds number dependence, meaning that calibrating at a larger number of velocities is sometimes required for optimum accuracy.
The prism-style head is more compact, which can be useful if sample ports are small. The prism style also has slightly larger hole sizes, making pluggage less likely in particulate or moisture-laden flows. For flows with very high particulate levels, such as pulverized coal flow, a dirty air probe may be a better choice.
How can I customize a 3D probe?
Our 3D probes are available in multiple sizes, from 2 ft – 14 ft. All probes are supplied with a custom leak check hood, allowing for rapid system leak checks, especially when paired with ASE data acquisition equipment.
Probes can include an integrated type-K thermocouple along with additional options. You can equip a 3D probe with hard pressure line break-outs and quick-connect pigtails to prolong the life of the pressure lines from regular wear and tear and reduce the chances of probe leakage.

3D probes can include hard pressure line break outs (left) and integrated inclinometer (right)
The user can select an inclinometer or laser, or both, for yaw angle measurement. When paired with an ASE data acquisition system, the inclinometer, yaw angle laser, and leak check components can all be included in a rugged, protective case.
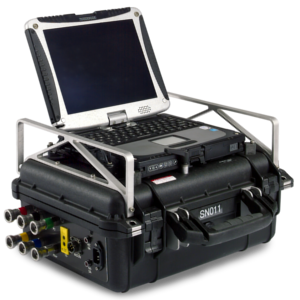
What data acquisition system should I use?
While it’s possible to read the multiple differential pressures on separate pressure measurement devices (manometers), we recommend combining a 3D probe with either the 3DDAS or the Magic Box system for automated data acquisition. When using a data acquisition system, our easy-to-use software guides the user through the test protocol using an onboard computer, touchscreen, or hand-held remote. Built-in programming controls all system functions, including data logging, data reduction, report generation, and error checking to maximize accuracy and minimize test time. It’s the easiest, most accurate way to perform 3D flow testing.
Both systems are highly accurate and have plenty of options to boost or pare down your system to meet your budget and testing needs. We created both of these data acquisition systems particularly for 3D flow testing, and you will never see us use a 3D probe without one!
If your 3D probe will be used in regulatory testing, the 3DDAS and Magic Box are designed to meet the testing requirements of EPA Method 2F.

Ordering from Airflow Sciences Equipment
Here at Airflow Sciences Equipment, we manufacture a full-line of accurate and rugged testing equipment that allows users to measure pressure, velocity, temperature, and particulate.
Ordering is simple. You can start the process today by filling out our contact form. An ASE engineer will be in touch shortly to ensure your order incorporates all technical, business, and budget needs.